Task #12279 (closed)
Bug: indexer OOM with 1GB
| Reported by: | jamoore | Owned by: | jamoore |
|---|---|---|---|
| Priority: | critical | Milestone: | 5.0.2 |
| Component: | Search | Version: | 5.0.1 |
| Keywords: | n.a. | Cc: | java@…, jballanco-x, dsudar@… |
| Resources: | n.a. | Referenced By: | n.a. |
| References: | n.a. | Remaining Time: | n.a. |
| Sprint: | n.a. |
Description
See: https://www.openmicroscopy.org/community/viewtopic.php?f=5&t=7508
Exceptions are still being seen with 5.0.1 in which the indexer OOMs even with substantial memory settings.
Attachments (1)
Change History (5)
Changed 5 years ago by jamoore
comment:1 Changed 5 years ago by jamoore
comment:2 Changed 5 years ago by jamoore
- Owner set to jamoore
- Status changed from new to accepted
comment:3 Changed 5 years ago by jamoore
- Resolution set to fixed
- Status changed from accepted to closed
Log from dogfish:
[omero_reference@ome-c6220-1-2 log]$ (head -n1;tail -n1) < Indexer-0.log
2014-05-23 10:10:10,592 INFO  [                ome.services.blitz.Entry] (      main) Waiting 10000 ms on startup
2014-05-27 07:04:16,446 WARN  [   ome.services.fulltext.FullTextIndexer] (2-thread-5) Null returned! Purging since cannot index ome.model.core.Pixels:Id_30292 for ome.model.meta.EventLog:Id_1167916
4 days of running, values from jmap -heap:
Heap Configuration:
   MinHeapFreeRatio = 40
   MaxHeapFreeRatio = 70
   MaxHeapSize      = 1073741824 (1024.0MB)
   NewSize          = 1310720 (1.25MB)
   MaxNewSize       = 17592186044415 MB
   OldSize          = 5439488 (5.1875MB)
   NewRatio         = 2
   SurvivorRatio    = 8
   PermSize         = 21757952 (20.75MB)
   MaxPermSize      = 174063616 (166.0MB)
   G1HeapRegionSize = 0 (0.0MB)
and top:
50215 omero_re 20 0 4359m 714m 15m S 0.7 0.7 47:15.98 java
No OOMs in the log. Closing.
comment:4 Changed 5 years ago by jmoore <josh@…>
(In [29336d59c3bc122a97c007dd4d6e33cb034c73a2/ome.git] on branch develop) Use params for event log query (See #12279)
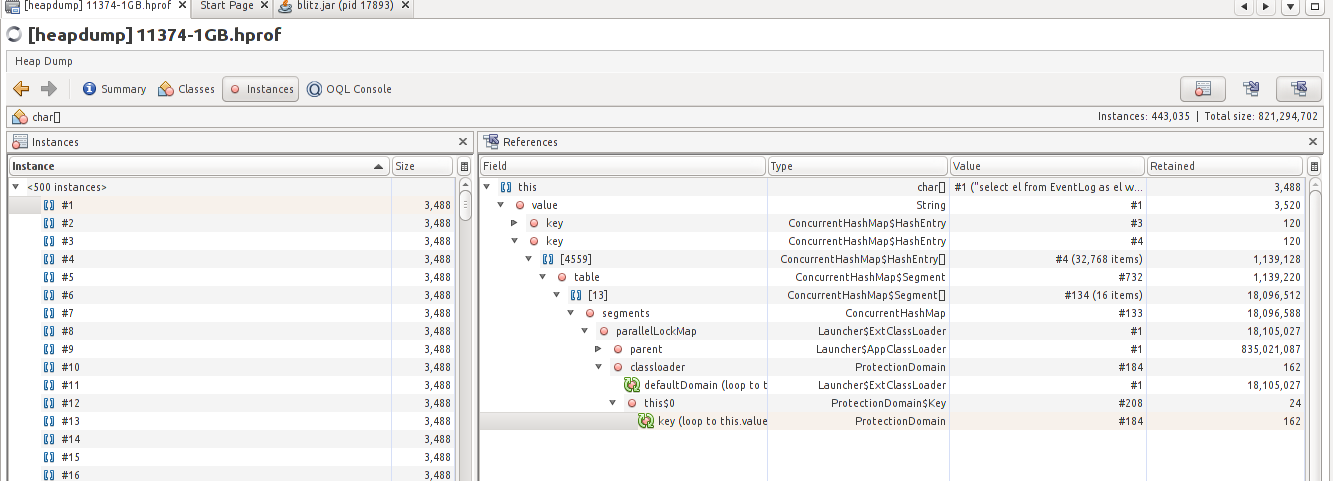
The memory dump from the demo server had over 800MB tied up
in char[] all belonging to the Launcher$AppClassLoader.
Nearly all of them (>400K instances) were of the form:
select el from EventLog el where el.id > SOMEID
That change is from roughly 2009 yet I've never seen
precisely this issue. Perhaps the recent move of the
flush() invocation was leaving more instances dangling.
In any event, this should collapse all 400K instances
down to one.

Screenshot of jvisualvm