Task #9795 (closed)
Opened 7 years ago
Closed 3 years ago
BUG: Error during ROI evaluation
| Reported by: | pwalczysko | Owned by: | jburel |
|---|---|---|---|
| Priority: | major | Milestone: | ROI |
| Component: | Insight | Version: | OMERO-5.2.0 |
| Keywords: | ROI | Cc: | rkferguson |
| Resources: | n.a. | Referenced By: | n.a. |
| References: | n.a. | Remaining Time: | n.a. |
| Sprint: | n.a. |
Description (last modified by pwalczysko)
Logged in as user-3 on Howe. Build OMERO.insight-4.4.4-133-6d0aeed-dirty-ice33-b37-mac. Opened image acqp [RA_RAREVTR_bas #17]. Created a rectangular and a circular region. Propagated it over z and t. (the circular region over all possible planes) Merged the circular and rectangular region. Deleted some shapes (from Propagate window, selecting "Remove ROI" and de-propagating it. Then clicked onto the "Results" tab. An error message appeared saying "Analysing data. An error occured while analysing the data" [see squig/screenshots/4.5_Sprint 1/Petr/25-10-12/001]. Clicked OK. The Results tab remained gray. After a while and couple of actions (removing shapes), the Results tab started to show data. The Graph Pane remains grey. Also the Graph Pane, Intensity View and Intensity Results View remain grey. Although pressed the "Add selected" button on Intensity Results View pane, no results were added. See also squig ...25-10-12/002 and 003 and 004.
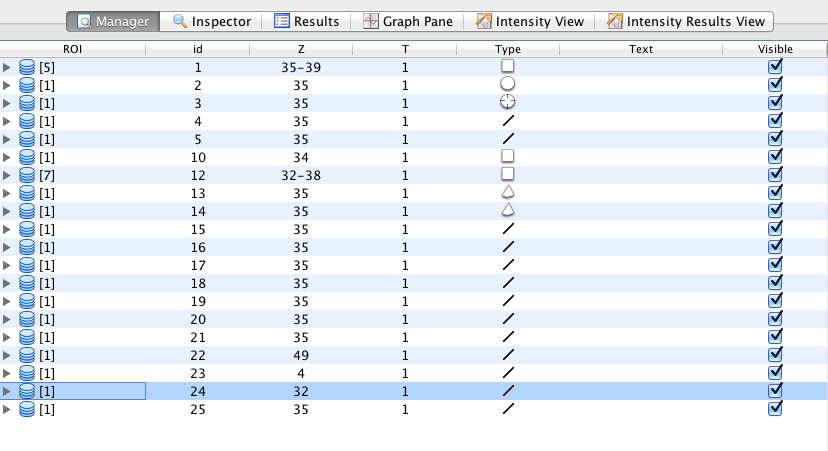
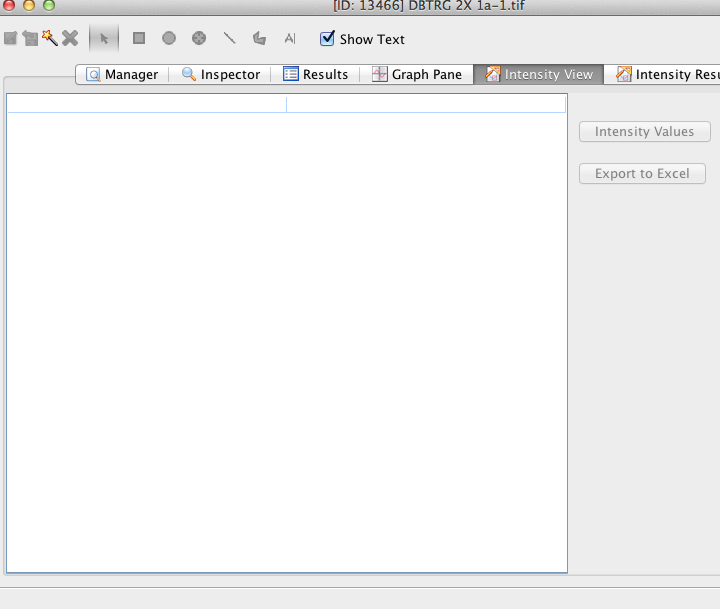
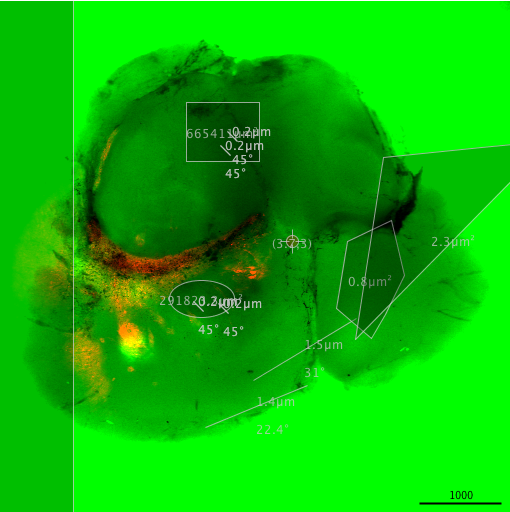
After some time, the same repeated with image fluoview/DETRG 2x 1a-1.tif. This time many more actions were performed before the bug appeared. Less than 100 shapes were created, chosen, merged, split, commented with text, shown in Results tab, shown in Graphs tab in different z levels.When scrolling in Graphs tab through the different histograms at different z-planes the bug appeared. The result was okay Manager, Inspector, Results tab, but frozen Graphs tab and blank Intensity View and Intensity Results View tabs (in Intensity Results View again you can click on Add selected button, but the selected regions results are not being added).
Attachments (3)
Change History (13)
comment:1 Changed 7 years ago by pwalczysko
- Description modified (diff)
comment:2 Changed 7 years ago by pwalczysko
- Description modified (diff)
Changed 7 years ago by pwalczysko
Changed 7 years ago by pwalczysko
Changed 7 years ago by pwalczysko
comment:3 Changed 7 years ago by pwalczysko
- Description modified (diff)
comment:4 Changed 7 years ago by pwalczysko
comment:5 Changed 7 years ago by jburel
- Sprint changed from 2012-11-20 (2) to 2012-12-18 (3)
Moved from sprint 2012-11-20 (2)
comment:6 Changed 7 years ago by pwalczysko
The bug reappeared today on Howe. It is probably connected with efficiency of region evaluation when large amounts of data are in question.
Build
OMERO.insight-4.4.5-135-d792f2c-dirty-ice33-b76-mac on Howe.
Logged in as user-6 on Howe.
On image in the "dv/IAGFP-Noc01_R3D.dv" dataset there was a pre-done rectangular region encompassing ~70% of the image, propagated over all 3 z-planes and all the ~twenty- t-planes.
Opened the ROI Tool window.
Selected the region (being on the first tab of ROI Tools window).
Went to the other tabs towards the Intensity Results View, as it was quite slow to react, went back and forth couple of times (certainly was at the Intensity View tab as well). Then Insight started to freeze slightly (beach-ball), then an error message appeared (see below) and a small dialog "An error occured while analysing the data".
Cancelled the error message. Insight closed.
Repeated the above scenario.
First time got to the Intensity Results View tab.
I (probably) did not click on "Add selected" button at all - nevertheless the vaules were in the table (the region was selected from before, I just went to the tab). Although the values were in the table, the "Remove all" button was greyed out.
Clicked on Add selected button now. Now the "Remove all" button became active. I pressed it and then possibly did something else (sorry, for this bad description, the program reacts pretty slow) and the again an error dialog popped up "An error occured while analysing the data".
Clicked OK.
No exceptions appeared.
Insight works further.
But the Intensity View is empty although it should not be (probably as a result of the abovementioned error).
Insight stopped reatcting (at least partially).
Did Force Quit
Repeated once more
Selected the region being on the first tab of the ROI Tool.
Went through to the Intiensity Results View (more slowly and gently).
Intensity View works and shows values.
Came to Intensity Results View.
The table is empty.
The "Add selected" button is active, the Remove all button greyed out
Pressed "Add selected" button.
The "Remove all button became active.
The table is still empty.
The dialog "An error occurred while..." appeared.
Clicked OK
Inisght reacts fine, but the Intensity Results View table is still empty although pressed Add selected button couple of times.
The Intensity View tab is fine and full of values and reacting.
The Graph Tab is also empty.
Repeated once more.
Went through the tabs very slowly. Graphs appeared OK. Went to Intensity View. Values in this tab never appeared.
Error appeared (see at the bottom of this page).
Seems similar to the error which occured during the first run.
Insight closed.
java.lang.Exception: Abnormal termination due to an uncaught exception.
java.lang.OutOfMemoryError: Java heap space
at java.awt.EventQueue.postEvent(EventQueue.java:303)
at java.awt.EventQueue.postEventPrivate(EventQueue.java:255)
at java.awt.EventQueue.postEvent(EventQueue.java:228)
at java.awt.Component.show(Component.java:1574)
at java.awt.Window.show(Window.java:873)
at javax.swing.Popup$HeavyWeightWindow.show(Popup.java:232)
at javax.swing.Popup.show(Popup.java:86)
at javax.swing.ToolTipManager.showTipWindow(ToolTipManager.java:298)
at javax.swing.ToolTipManager$insideTimerAction.actionPerformed(ToolTipManager.java:668)
at javax.swing.Timer.fireActionPerformed(Timer.java:291)
at javax.swing.Timer$DoPostEvent.run(Timer.java:221)
at java.awt.event.InvocationEvent.dispatch(InvocationEvent.java:209)
at java.awt.EventQueue.dispatchEventImpl(EventQueue.java:702)
at java.awt.EventQueue.access$400(EventQueue.java:82)
at java.awt.EventQueue$2.run(EventQueue.java:663)
at java.awt.EventQueue$2.run(EventQueue.java:661)
at java.security.AccessController.doPrivileged(Native Method)
at java.security.AccessControlContext$1.doIntersectionPrivilege(AccessControlContext.java:87)
at java.awt.EventQueue.dispatchEvent(EventQueue.java:672)
at java.awt.EventDispatchThread.pumpOneEventForFilters(EventDispatchThread.java:296)
at java.awt.EventDispatchThread.pumpEventsForFilter(EventDispatchThread.java:211)
at java.awt.EventDispatchThread.pumpEventsForHierarchy(EventDispatchThread.java:201)
at java.awt.EventDispatchThread.pumpEvents(EventDispatchThread.java:196)
at java.awt.EventDispatchThread.pumpEvents(EventDispatchThread.java:188)
at java.awt.EventDispatchThread.run(EventDispatchThread.java:122)
Abnormal termination due to an uncaught exception.
java.lang.OutOfMemoryError: Java heap space
at java.awt.EventQueue.postEvent(EventQueue.java:303)
at java.awt.EventQueue.postEventPrivate(EventQueue.java:255)
at java.awt.EventQueue.postEvent(EventQueue.java:228)
at java.awt.Component.show(Component.java:1574)
at java.awt.Window.show(Window.java:873)
at javax.swing.Popup$HeavyWeightWindow.show(Popup.java:232)
at javax.swing.Popup.show(Popup.java:86)
at javax.swing.ToolTipManager.showTipWindow(ToolTipManager.java:298)
at javax.swing.ToolTipManager$insideTimerAction.actionPerformed(ToolTipManager.java:668)
at javax.swing.Timer.fireActionPerformed(Timer.java:291)
at javax.swing.Timer$DoPostEvent.run(Timer.java:221)
at java.awt.event.InvocationEvent.dispatch(InvocationEvent.java:209)
at java.awt.EventQueue.dispatchEventImpl(EventQueue.java:702)
at java.awt.EventQueue.access$400(EventQueue.java:82)
at java.awt.EventQueue$2.run(EventQueue.java:663)
at java.awt.EventQueue$2.run(EventQueue.java:661)
at java.security.AccessController.doPrivileged(Native Method)
at java.security.AccessControlContext$1.doIntersectionPrivilege(AccessControlContext.java:87)
at java.awt.EventQueue.dispatchEvent(EventQueue.java:672)
at java.awt.EventDispatchThread.pumpOneEventForFilters(EventDispatchThread.java:296)
at java.awt.EventDispatchThread.pumpEventsForFilter(EventDispatchThread.java:211)
at java.awt.EventDispatchThread.pumpEventsForHierarchy(EventDispatchThread.java:201)
at java.awt.EventDispatchThread.pumpEvents(EventDispatchThread.java:196)
at java.awt.EventDispatchThread.pumpEvents(EventDispatchThread.java:188)
at java.awt.EventDispatchThread.run(EventDispatchThread.java:122)
Exception in thread "AWT-EventQueue-0"

at org.openmicroscopy.shoola.env.ui.UserNotifierImpl.showErrorDialog(UserNotifierImpl.java:189)
at org.openmicroscopy.shoola.env.ui.UserNotifierImpl.notifyError(UserNotifierImpl.java:287)
at org.openmicroscopy.shoola.env.AbnormalExitHandler.doTermination(AbnormalExitHandler.java:146)
at org.openmicroscopy.shoola.env.AbnormalExitHandler.terminate(AbnormalExitHandler.java:84)
at org.openmicroscopy.shoola.env.AWTExceptionHanlder.handle(AWTExceptionHanlder.java:99)
at sun.reflect.NativeMethodAccessorImpl.invoke0(Native Method)
at sun.reflect.NativeMethodAccessorImpl.invoke(NativeMethodAccessorImpl.java:39)
at sun.reflect.DelegatingMethodAccessorImpl.invoke(DelegatingMethodAccessorImpl.java:25)
at java.lang.reflect.Method.invoke(Method.java:597)
at java.awt.EventDispatchThread.handleException(EventDispatchThread.java:412)
at java.awt.EventDispatchThread.processException(EventDispatchThread.java:318)
at java.awt.EventDispatchThread.pumpOneEventForFilters(EventDispatchThread.java:312)
at java.awt.EventDispatchThread.pumpEventsForFilter(EventDispatchThread.java:211)
at java.awt.EventDispatchThread.pumpEventsForHierarchy(EventDispatchThread.java:201)
at java.awt.EventDispatchThread.pumpEvents(EventDispatchThread.java:196)
at java.awt.EventDispatchThread.pumpEvents(EventDispatchThread.java:188)
at java.awt.EventDispatchThread.run(EventDispatchThread.java:122)
Error from the last repeat:
java.lang.Exception: Abnormal termination due to an uncaught exception.
java.lang.OutOfMemoryError: Java heap space
at java.security.AccessController.getStackAccessControlContext(Native Method)
at java.security.AccessController.getContext(AccessController.java:484)
at java.awt.AWTEvent.(AWTEvent.java:91)
at java.awt.event.ActionEvent.(ActionEvent.java:181)
at javax.swing.Timer$DoPostEvent.run(Timer.java:221)
at java.awt.event.InvocationEvent.dispatch(InvocationEvent.java:209)
at java.awt.EventQueue.dispatchEventImpl(EventQueue.java:702)
at java.awt.EventQueue.access$400(EventQueue.java:82)
at java.awt.EventQueue$2.run(EventQueue.java:663)
at java.awt.EventQueue$2.run(EventQueue.java:661)
at java.security.AccessController.doPrivileged(Native Method)
at java.security.AccessControlContext$1.doIntersectionPrivilege(AccessControlContext.java:87)
at java.awt.EventQueue.dispatchEvent(EventQueue.java:672)
at java.awt.EventDispatchThread.pumpOneEventForFilters(EventDispatchThread.java:296)
at java.awt.EventDispatchThread.pumpEventsForFilter(EventDispatchThread.java:211)
at java.awt.EventDispatchThread.pumpEventsForHierarchy(EventDispatchThread.java:201)
at java.awt.EventDispatchThread.pumpEvents(EventDispatchThread.java:196)
at java.awt.EventDispatchThread.pumpEvents(EventDispatchThread.java:188)
at java.awt.EventDispatchThread.run(EventDispatchThread.java:122)
Abnormal termination due to an uncaught exception.
java.lang.OutOfMemoryError: Java heap space
at java.security.AccessController.getStackAccessControlContext(Native Method)
at java.security.AccessController.getContext(AccessController.java:484)
at java.awt.AWTEvent.(AWTEvent.java:91)
at java.awt.event.ActionEvent.(ActionEvent.java:181)
at javax.swing.Timer$DoPostEvent.run(Timer.java:221)
at java.awt.event.InvocationEvent.dispatch(InvocationEvent.java:209)
at java.awt.EventQueue.dispatchEventImpl(EventQueue.java:702)
at java.awt.EventQueue.access$400(EventQueue.java:82)
at java.awt.EventQueue$2.run(EventQueue.java:663)
at java.awt.EventQueue$2.run(EventQueue.java:661)
at java.security.AccessController.doPrivileged(Native Method)
at java.security.AccessControlContext$1.doIntersectionPrivilege(AccessControlContext.java:87)
at java.awt.EventQueue.dispatchEvent(EventQueue.java:672)
at java.awt.EventDispatchThread.pumpOneEventForFilters(EventDispatchThread.java:296)
at java.awt.EventDispatchThread.pumpEventsForFilter(EventDispatchThread.java:211)
at java.awt.EventDispatchThread.pumpEventsForHierarchy(EventDispatchThread.java:201)
at java.awt.EventDispatchThread.pumpEvents(EventDispatchThread.java:196)
at java.awt.EventDispatchThread.pumpEvents(EventDispatchThread.java:188)
at java.awt.EventDispatchThread.run(EventDispatchThread.java:122)
Exception in thread "AWT-EventQueue-0"

at org.openmicroscopy.shoola.env.ui.UserNotifierImpl.showErrorDialog(UserNotifierImpl.java:189)
at org.openmicroscopy.shoola.env.ui.UserNotifierImpl.notifyError(UserNotifierImpl.java:287)
at org.openmicroscopy.shoola.env.AbnormalExitHandler.doTermination(AbnormalExitHandler.java:146)
at org.openmicroscopy.shoola.env.AbnormalExitHandler.terminate(AbnormalExitHandler.java:84)
at org.openmicroscopy.shoola.env.RootThreadGroup.uncaughtException(RootThreadGroup.java:69)
at java.lang.Thread.dispatchUncaughtException(Thread.java:1898)
comment:7 Changed 7 years ago by pwalczysko
- Priority changed from minor to major
comment:8 Changed 7 years ago by jburel
- Sprint 2012-12-18 (3) deleted
comment:9 Changed 3 years ago by jamoore
- Milestone changed from 5.x to ROI
comment:10 Changed 3 years ago by dlindner
- Resolution set to fixed
- Status changed from new to closed
- Version set to OMERO-5.2.0

This bug is not easily repeatable. Also the fluoview image which is mentioned in the description above does not produce the erroe.
The "Add selected" button not functioning bug (Intensity Resutls View tab) which is also described here was reformulated, firmed upon and re-tested, made reliable and a new ticket was created for it - see #9925.