Task #9795 (new)
Opened 12 years ago
Last modified 8 years ago
BUG: Error during ROI evaluation — at Version 3
| Reported by: | pwalczysko | Owned by: | jburel |
|---|---|---|---|
| Priority: | minor | Milestone: | 5.x |
| Component: | Insight | Version: | n.a. |
| Keywords: | ROI | Cc: | rkferguson |
| Resources: | n.a. | Referenced By: | n.a. |
| References: | n.a. | Remaining Time: | n.a. |
| Sprint: | 2012-11-20 (2) |
Description (last modified by pwalczysko)
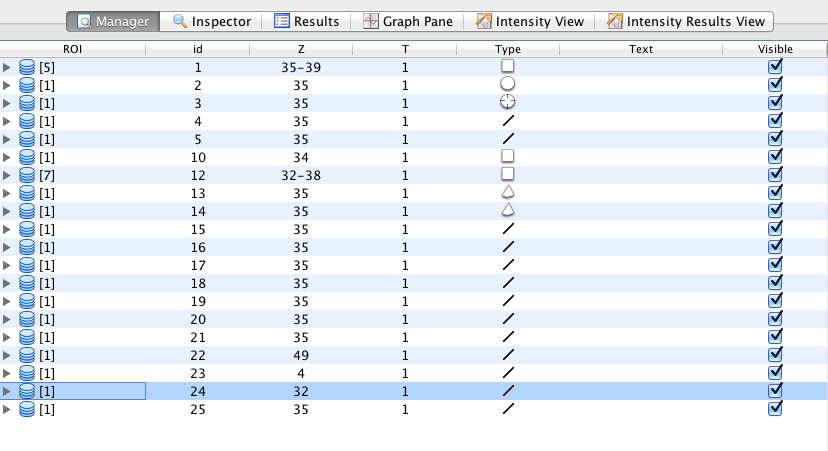
Logged in as user-3 on Howe. Build OMERO.insight-4.4.4-133-6d0aeed-dirty-ice33-b37-mac. Opened image acqp [RA_RAREVTR_bas #17]. Created a rectangular and a circular region. Propagated it over z and t. (the circular region over all possible planes) Merged the circular and rectangular region. Deleted some shapes (from Propagate window, selecting "Remove ROI" and de-propagating it. Then clicked onto the "Results" tab. An error message appeared saying "Analysing data. An error occured while analysing the data" [see squig/screenshots/4.5_Sprint 1/Petr/25-10-12/001]. Clicked OK. The Results tab remained gray. After a while and couple of actions (removing shapes), the Results tab started to show data. The Graph Pane remains grey. Also the Graph Pane, Intensity View and Intensity Results View remain grey. Although pressed the "Add selected" button on Intensity Results View pane, no results were added. See also squig ...25-10-12/002 and 003 and 004.
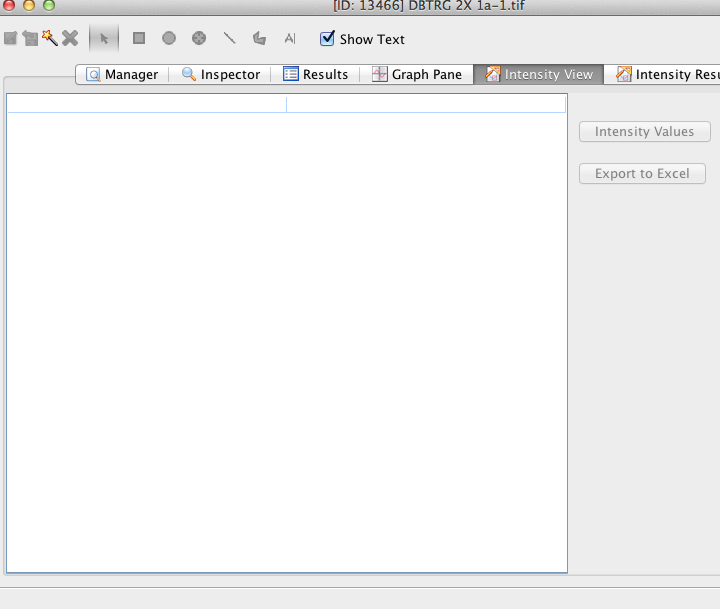
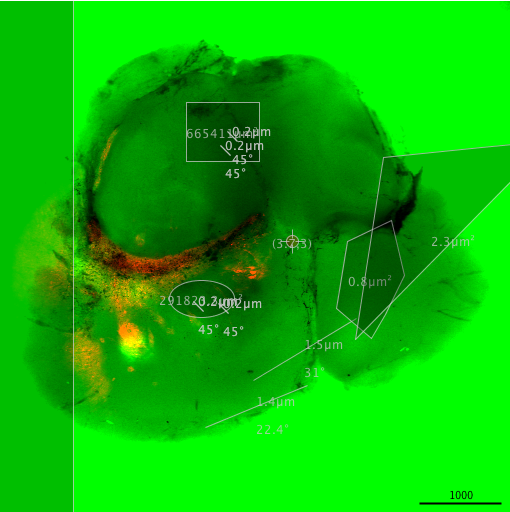
After some time, the same repeated with image fluoview/DETRG 2x 1a-1.tif. This time many more actions were performed before the bug appeared. Less than 100 shapes were created, chosen, merged, split, commented with text, shown in Results tab, shown in Graphs tab in different z levels.When scrolling in Graphs tab through the different histograms at different z-planes the bug appeared. The result was okay Manager, Inspector, Results tab, but frozen Graphs tab and blank Intensity View and Intensity Results View tabs (in Intensity Results View again you can click on Add selected button, but the selected regions results are not being added).
Change History (6)
comment:1 Changed 12 years ago by pwalczysko
- Description modified (diff)
comment:2 Changed 12 years ago by pwalczysko
- Description modified (diff)
Changed 12 years ago by pwalczysko
Changed 12 years ago by pwalczysko
Changed 12 years ago by pwalczysko
comment:3 Changed 12 years ago by pwalczysko
- Description modified (diff)
